Before we begin, it is critical that you visit the “About IVR” page on the daily sectionals website by clicking HERE.
Once you have done that, you should have a basic understanding of the level of sophistication that makes up the IVR. If you have any questions regarding the IVR rating, please contact Vince Accardi directly. He is a fantastic individual and will be able to help with your queries.
- About IVR: https://dailysectionals.com.au/?page=services-about-ivr
- Contact Daily Sectionals: https://dailysectionals.com.au/contact
Frequently Asked Questions:
IVR® stands for INCREMENTAL VELOCITY RATING. More information regarding the IVR, please visit https://dailysectionals.com.au/?page=services-about-ivr
Yes. In discussions with Vince Accardi, the understanding is that the IVR is an adjusted figure from its original raw form. The process has been completed internally within Daily Sectionals to normalize the IVR against track conditions, meeting types and other variables on the day. For example, an IVR figure from the country to metro will stand true.
Please visit the following link https://dailysectionals.com.au/?page=products-pricing to obtain IVR data.
RAPRO “Racing Analytics Professional” manages all the data files you receive from daily sectionals, loads them into a database and allows you to run reports to search for horses, upcoming races and display insights. Without RAPRO you would end up with 1000+ separate excel files which makes it near impossible to look up an individual horse and its historical IVR figure quickly.
IVR® – INCREMENTAL VELOCITY RATING
To be able to perform a similar analysis as to what we have done in this article, you will need to purchase two items.
- 365 Days of IVR Back Data (VIC/NSW/SA)
- Available at https://dailysectionals.com.au/?page=products-pricing
- Contact Vince for a quote on back data. (Let him know STATFREAKS sent you)
- IVR Data comes in 2 x excel files, Daily Ranking, and Sectional Review.
- Post race IVR data is sent out daily/weekly via email.
- Racing Analytics Professional (RAPRO)
- Available at https://racinganalyticspro.com.au/
- This software manages all of the daily sectionals data files and provides analytics, history data search, and insights.
- One year subscription $990, then $495 every ongoing year.
- Does not come with data, requires daily sectionals subscription
- If you purchase it the same time as a subscription from Daily Sectionals, RAPRO pre-load the historical data for you.
In a nutshell, you buy the data files from Daily Sectionals and load them into RAPRO, pretty simple.
THIS ARTICLE IS LEVEL

This article is best suited for punters who are seeking to move into the professional field, and already professional punters.
Without going into much detail on how to use Racing Analytics Professional, we opened up a report called “DAS-01.Form Guide-IVR-Extended”. Once loaded up we were presented with an excellent, clear visual layout with all our data we loaded from Daily Sectionals.
For this introduction, we will focus on Caulfield Race 4 on the 1/9/2018.
In RAPRO, the horses listed in order of there TAB Number. For this exercise, we will drill into each runner and plot in excel the Best IVR figure for each horse where it has run at 1400m or near enough which will allow us to get a comparison between each runner.
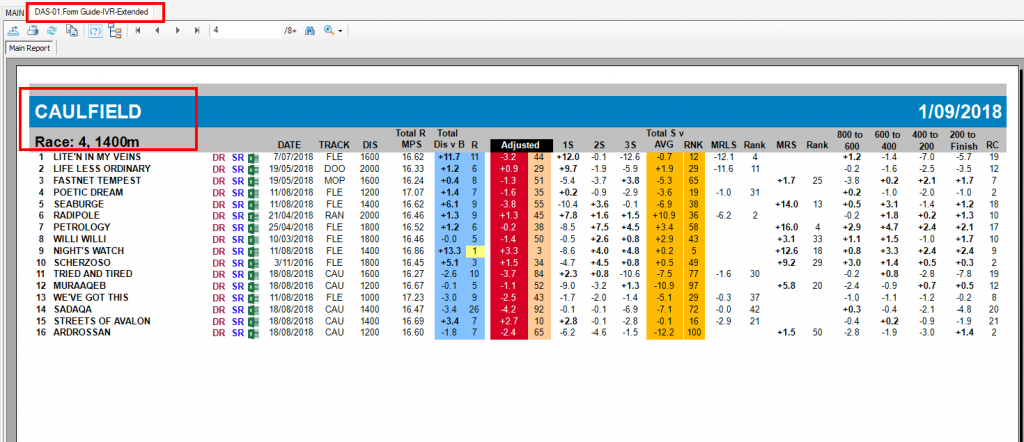
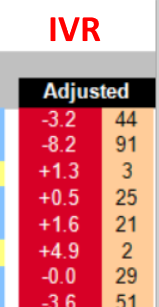
By double clicking on each horse, we were able to drill down to see the runners historical runs. We then logged the IVR Figure (Highlighted in RED) into excel which gave us a basic understanding of where each runner rated. Once we completed all the runners, we sorted the list from highest IVR to smallest.
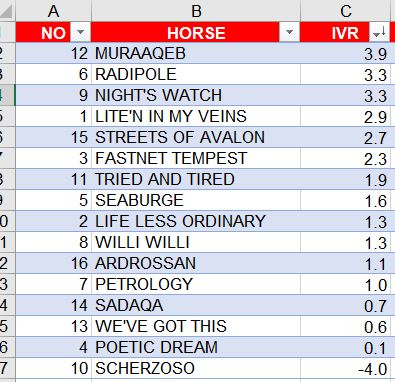
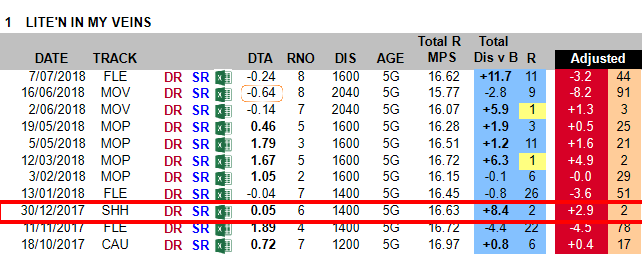

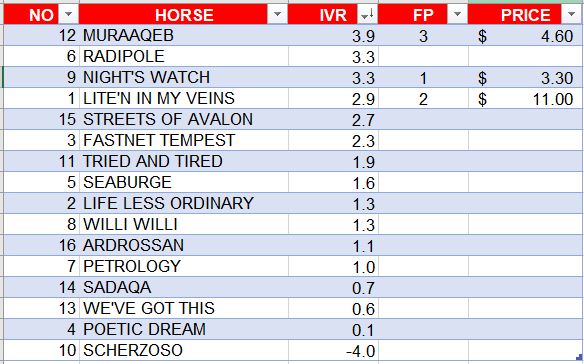
The outcome without any further adjustments, considerations of speed maps, settling positions or statistics was quite surprising. From the top 4 rated horses the winner was identified along with the horses that placed 2nd and 3rd.
The IVR figure from Daily Sectionals has already had adjustments made to factor in track conditions, track bias and other variables on the day. Therefore there is no further need to normalize the IVR figure as its done so already. An IVR figure from one track will stand up on another regardless of class or meeting type. We firmly believe because of this, the Daily Sectionals IVR figure is one of the best rating type figures available on the market today and why at STATFREAKS we use daily sectionals data to perform our analysis and research.
